Profiling tools
2024
The profiler analyzes the execution of a program to identify performance bottlenecks, memory leaks, and other inefficiencies. Profilers can be used to collect a variety of data about a program’s execution, including CPU usage, memory usage, function call counts, and instruction counts.
strace
Trace all system calls in a program.
Example of use
$ strace /bin/ls
execve("/bin/ls", ["/bin/ls"], 0x7ffe3c89a0b0 /* 28 vars */) = 0
brk(NULL)                               = 0x561f928d5000
mmap(NULL, 8192, PROT_READ|PROT_WRITE, MAP_PRIVATE|MAP_ANONYMOUS, -1, 0) = 0x7fe9d75ab000
access("/etc/ld.so.preload", R_OK)      = -1 ENOENT (No such file or directory)
openat(AT_FDCWD, "/etc/ld.so.cache", O_RDONLY|O_CLOEXEC) = 3
newfstatat(3, "", {st_mode=S_IFREG|0644, st_size=43302, ...}, AT_EMPTY_PATH) = 0
mmap(NULL, 43302, PROT_READ, MAP_PRIVATE, 3, 0) = 0x7fe9d75a0000
close(3)                                = 0
openat(AT_FDCWD, "/lib/x86_64-linux-gnu/libselinux.so.1", O_RDONLY|O_CLOEXEC) = 3
read(3, "\177ELF\2\1\1\0\0\0\0\0\0\0\0\0\3\0>\0\1\0\0\0\0\0\0\0\0\0\0\0"..., 832) = 832
newfstatat(3, "", {st_mode=S_IFREG|0644, st_size=174312, ...}, AT_EMPTY_PATH) = 0
mmap(NULL, 186064, PROT_READ, MAP_PRIVATE|MAP_DENYWRITE, 3, 0) = 0x7fe9d7572000
mmap(0x7fe9d7579000, 110592, PROT_READ|PROT_EXEC, MAP_PRIVATE|MAP_FIXED|MAP_DENYWRITE, 3, 0x7000) = 0x7fe9d7579000
mmap(0x7fe9d7594000, 32768, PROT_READ, MAP_PRIVATE|MAP_FIXED|MAP_DENYWRITE, 3, 0x22000) = 0x7fe9d7594000
mmap(0x7fe9d759c000, 8192, PROT_READ|PROT_WRITE, MAP_PRIVATE|MAP_FIXED|MAP_DENYWRITE, 3, 0x29000) = 0x7fe9d759c000
mmap(0x7fe9d759e000, 5840, PROT_READ|PROT_WRITE, MAP_PRIVATE|MAP_FIXED|MAP_ANONYMOUS, -1, 0) = 0x7fe9d759e000
close(3)                                = 0
openat(AT_FDCWD, "/lib/x86_64-linux-gnu/libc.so.6", O_RDONLY|O_CLOEXEC) = 3
read(3, "\177ELF\2\1\1\3\0\0\0\0\0\0\0\0\3\0>\0\1\0\0\0\220s\2\0\0\0\0\0"..., 832) = 832
pread64(3, "\6\0\0\0\4\0\0\0@\0\0\0\0\0\0\0@\0\0\0\0\0\0\0@\0\0\0\0\0\0\0"..., 784, 64) = 784
newfstatat(3, "", {st_mode=S_IFREG|0755, st_size=1922136, ...}, AT_EMPTY_PATH) = 0
pread64(3, "\6\0\0\0\4\0\0\0@\0\0\0\0\0\0\0@\0\0\0\0\0\0\0@\0\0\0\0\0\0\0"..., 784, 64) = 784
mmap(NULL, 1970000, PROT_READ, MAP_PRIVATE|MAP_DENYWRITE, 3, 0) = 0x7fe9d7391000
mmap(0x7fe9d73b7000, 1396736, PROT_READ|PROT_EXEC, MAP_PRIVATE|MAP_FIXED|MAP_DENYWRITE, 3, 0x26000) = 0x7fe9d73b7000
mmap(0x7fe9d750c000, 339968, PROT_READ, MAP_PRIVATE|MAP_FIXED|MAP_DENYWRITE, 3, 0x17b000) = 0x7fe9d750c000
mmap(0x7fe9d755f000, 24576, PROT_READ|PROT_WRITE, MAP_PRIVATE|MAP_FIXED|MAP_DENYWRITE, 3, 0x1ce000) = 0x7fe9d755f000
mmap(0x7fe9d7565000, 53072, PROT_READ|PROT_WRITE, MAP_PRIVATE|MAP_FIXED|MAP_ANONYMOUS, -1, 0) = 0x7fe9d7565000
close(3)                                = 0
openat(AT_FDCWD, "/lib/x86_64-linux-gnu/libpcre2-8.so.0", O_RDONLY|O_CLOEXEC) = 3
read(3, "\177ELF\2\1\1\0\0\0\0\0\0\0\0\0\3\0>\0\1\0\0\0\0\0\0\0\0\0\0\0"..., 832) = 832
newfstatat(3, "", {st_mode=S_IFREG|0644, st_size=629384, ...}, AT_EMPTY_PATH) = 0
mmap(NULL, 627592, PROT_READ, MAP_PRIVATE|MAP_DENYWRITE, 3, 0) = 0x7fe9d72f7000
mmap(0x7fe9d72f9000, 438272, PROT_READ|PROT_EXEC, MAP_PRIVATE|MAP_FIXED|MAP_DENYWRITE, 3, 0x2000) = 0x7fe9d72f9000
mmap(0x7fe9d7364000, 176128, PROT_READ, MAP_PRIVATE|MAP_FIXED|MAP_DENYWRITE, 3, 0x6d000) = 0x7fe9d7364000
mmap(0x7fe9d738f000, 8192, PROT_READ|PROT_WRITE, MAP_PRIVATE|MAP_FIXED|MAP_DENYWRITE, 3, 0x98000) = 0x7fe9d738f000
close(3)                                = 0
mmap(NULL, 12288, PROT_READ|PROT_WRITE, MAP_PRIVATE|MAP_ANONYMOUS, -1, 0) = 0x7fe9d72f4000
arch_prctl(ARCH_SET_FS, 0x7fe9d72f4800) = 0
set_tid_address(0x7fe9d72f4ad0)         = 869
set_robust_list(0x7fe9d72f4ae0, 24)     = 0
rseq(0x7fe9d72f5120, 0x20, 0, 0x53053053) = 0
mprotect(0x7fe9d755f000, 16384, PROT_READ) = 0
mprotect(0x7fe9d738f000, 4096, PROT_READ) = 0
mprotect(0x7fe9d759c000, 4096, PROT_READ) = 0
mprotect(0x561f913e7000, 4096, PROT_READ) = 0
mprotect(0x7fe9d75dd000, 8192, PROT_READ) = 0
prlimit64(0, RLIMIT_STACK, NULL, {rlim_cur=8192*1024, rlim_max=RLIM64_INFINITY}) = 0
munmap(0x7fe9d75a0000, 43302)           = 0
statfs("/sys/fs/selinux", 0x7ffc981cb840) = -1 ENOENT (No such file or directory)
statfs("/selinux", 0x7ffc981cb840)      = -1 ENOENT (No such file or directory)
getrandom("\x3c\xff\xd9\x4f\x31\x58\xe5\x6d", 8, GRND_NONBLOCK) = 8
brk(NULL)                               = 0x561f928d5000
brk(0x561f928f6000)                     = 0x561f928f6000
openat(AT_FDCWD, "/proc/filesystems", O_RDONLY|O_CLOEXEC) = 3
newfstatat(3, "", {st_mode=S_IFREG|0444, st_size=0, ...}, AT_EMPTY_PATH) = 0
read(3, "nodev\tsysfs\nnodev\ttmpfs\nnodev\tbd"..., 1024) = 478
read(3, "", 1024)                       = 0
close(3)                                = 0
access("/etc/selinux/config", F_OK)     = -1 ENOENT (No such file or directory)
openat(AT_FDCWD, "/usr/lib/locale/locale-archive", O_RDONLY|O_CLOEXEC) = 3
newfstatat(3, "", {st_mode=S_IFREG|0644, st_size=3048928, ...}, AT_EMPTY_PATH) = 0
mmap(NULL, 3048928, PROT_READ, MAP_PRIVATE, 3, 0) = 0x7fe9d700b000
close(3)                                = 0
ioctl(1, TCGETS, {c_iflag=ICRNL|IXON, c_oflag=NL0|CR0|TAB0|BS0|VT0|FF0|OPOST|ONLCR, c_cflag=B38400|CS8|CREAD, c_lflag=ISIG|ICANON|ECHO|ECHOE|ECHOK|IEXTEN|ECHOCTL|ECHOKE, ...}) = 0
ioctl(1, TIOCGWINSZ, {ws_row=30, ws_col=120, ws_xpixel=0, ws_ypixel=0}) = 0
openat(AT_FDCWD, ".", O_RDONLY|O_NONBLOCK|O_CLOEXEC|O_DIRECTORY) = 3
newfstatat(3, "", {st_mode=S_IFDIR|0755, st_size=4096, ...}, AT_EMPTY_PATH) = 0
getdents64(3, 0x561f928dbce0 /* 30 entries */, 32768) = 800
getdents64(3, 0x561f928dbce0 /* 0 entries */, 32768) = 0
close(3)                                = 0
newfstatat(1, "", {st_mode=S_IFCHR|0620, st_rdev=makedev(0x88, 0x4), ...}, AT_EMPTY_PATH) = 0
write(1, "bin   dev     etc   init  lib32 "..., 99bin   dev     etc   init  lib32  libx32      media  opt   root       sbin  sys  usr   wsllbiimn  wslLndgEP
) = 99
write(1, "boot  Docker  home  lib   lib64 "..., 98boot  Docker  home  lib   lib64  lost+found  mnt    proc  run srv   tmp  var  wsllkBFJL  wslpLHphj
) = 98
close(1)                                = 0
close(2)                                = 0
exit_group(0)                           = ?
+++ exited with 0 +++
ltrace
ltrace is a dynamic debugging tool that tracks library calls made by a program.
Example of use
$ ltrace -c /bin/ls

% time     seconds  usecs/call     calls      function
------ ----------- ----------- --------- --------------------
 20.77    0.007439          55       135 __errno_location
 18.41    0.006595          58       113 strlen
 15.47    0.005542          53       104 strcoll
 13.04    0.004672          55        84 __ctype_get_mb_cur_max
  7.71    0.002760          54        51 __overflow
  6.88    0.002466          57        43 memcpy
  5.50    0.001971          63        31 readdir
  4.38    0.001570          56        28 fwrite_unlocked
  1.37    0.000491          61         8 getenv
  1.35    0.000482         482         1 setlocale
  0.61    0.000217          54         4 __freading
  0.60    0.000216          54         4 reallocarray
  0.55    0.000197          98         2 fclose
  0.40    0.000143         143         1 opendir
  0.38    0.000136         136         1 textdomain
  0.32    0.000115          57         2 fileno
  0.32    0.000113          56         2 __fpending
  0.30    0.000108          54         2 fflush
  0.28    0.000101         101         1 closedir
  0.27    0.000096          96         1 ioctl
  0.27    0.000096          96         1 isatty
  0.18    0.000064          64         1 strrchr
  0.17    0.000060          60         1 bindtextdomain
  0.16    0.000058          58         1 __cxa_atexit
  0.15    0.000055          55         1 _setjmp
  0.15    0.000055          55         1 getopt_long
------ ----------- ----------- --------- --------------------
100.00    0.035818                   624 total
callgrind
valgrind --tool=callgrind [callgrind options] your-program [program options]
Visualisation the result with kcachegrind
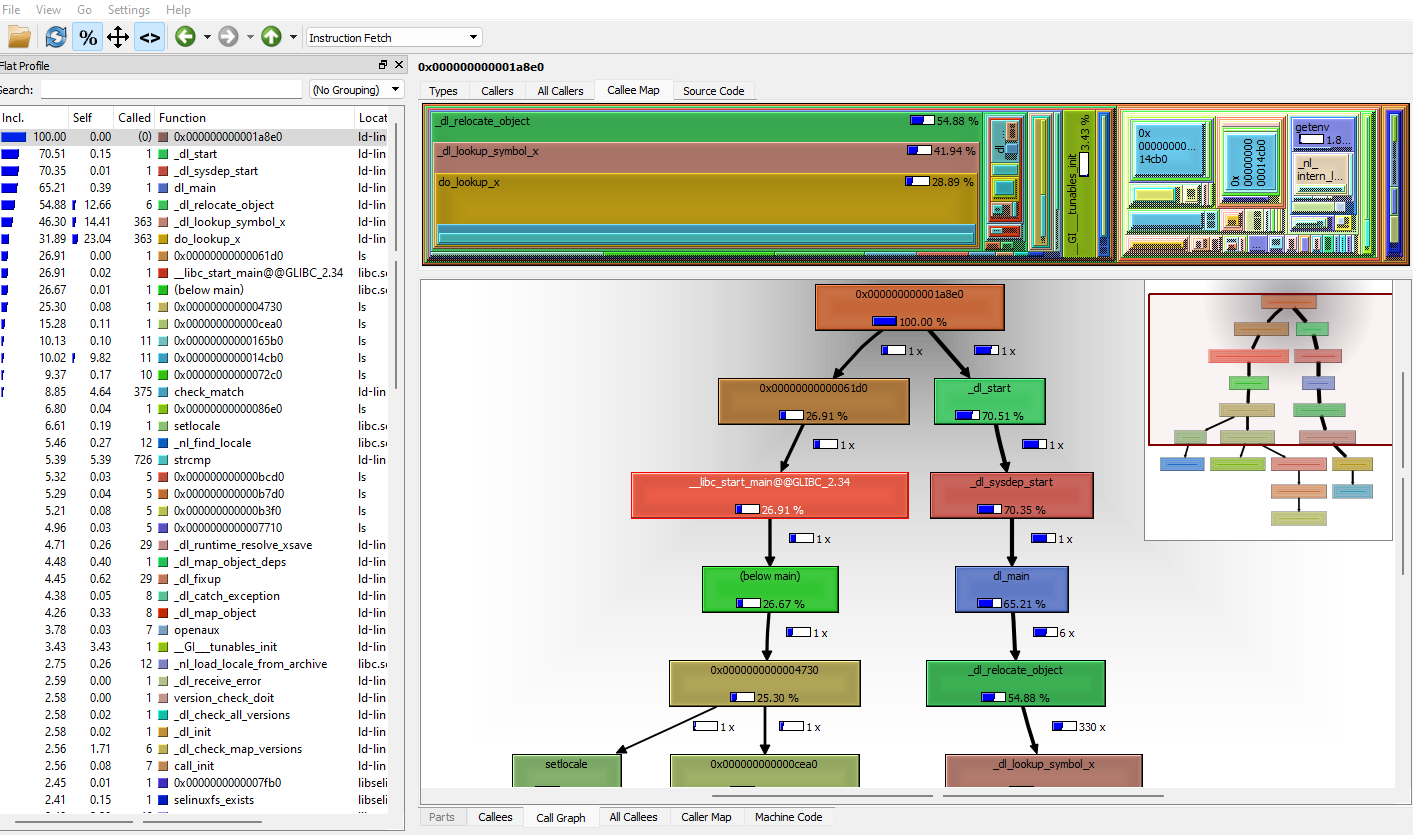
cf. Callgrind: a call-graph generating cache and branch prediction profiler
perf
Example of use
$ perf stat /bin/ls

Performance counter stats for '/bin/ls':

             0.34 msec task-clock:u                     #    0.684 CPUs utilized
                0      context-switches:u               #    0.000 /sec
                0      cpu-migrations:u                 #    0.000 /sec
               84      page-faults:u                    #  244.257 K/sec
  <not supported>      cycles:u
  <not supported>      instructions:u
  <not supported>      branches:u
  <not supported>      branch-misses:u

      0.000502696 seconds time elapsed

      0.000592000 seconds user
      0.000000000 seconds sys
Tracing function calls
cf. Tracing with GCC
addr2line can map an address to the corresponding source file.
gprof
Compile your program with the option -pg (either with the g++ or the gcc compiler). Run your program, which produces an extra file called gmon.out. Then run the following command to produce profiling information.
gprof a.out
where a.out is the name of your executable that you ran to profile
sprof
gperftools
heaptrack
cf. https://linux.developpez.com/tutoriels/apprendre-heaptrack/